
Numbers From the Floor, Not the Deck
Every figure below is operational and auditable — freight spend, cycle time, per-unit handling cost. No satisfaction scores. No estimated impact.
Real Operations. Measured Savings.
Problems differ by industry. The cost leakage follows the same patterns. Below is where we found it.
38% Reduction in Per-Unit Handling Cost
22% Drop in Freight Spend, Same Volume
A mid-size parts manufacturer was running three redundant staging steps between production and outbound freight. Process redesign alone — no new equipment — cut per-unit cost by 38% in 11 weeks.
A regional distributor was routing shipments through a legacy carrier mix that hadn't been audited in four years. Route restructuring and carrier consolidation cut freight spend 22% without reducing delivery frequency.
Metrics: per-unit handling cost, outbound cycle time, labor hours per shipment.
Metrics: freight cost per stop, carrier invoice variance, on-time delivery rate.
Dwell Time Cut from 6 Days to Under 2
Pick Error Rate Down 61% in One Quarter
An importer was absorbing demurrage charges on containers sitting at port because internal handoff documentation wasn't synchronized with arrival windows. Process fix reduced average dwell time from 6.1 days to 1.8.
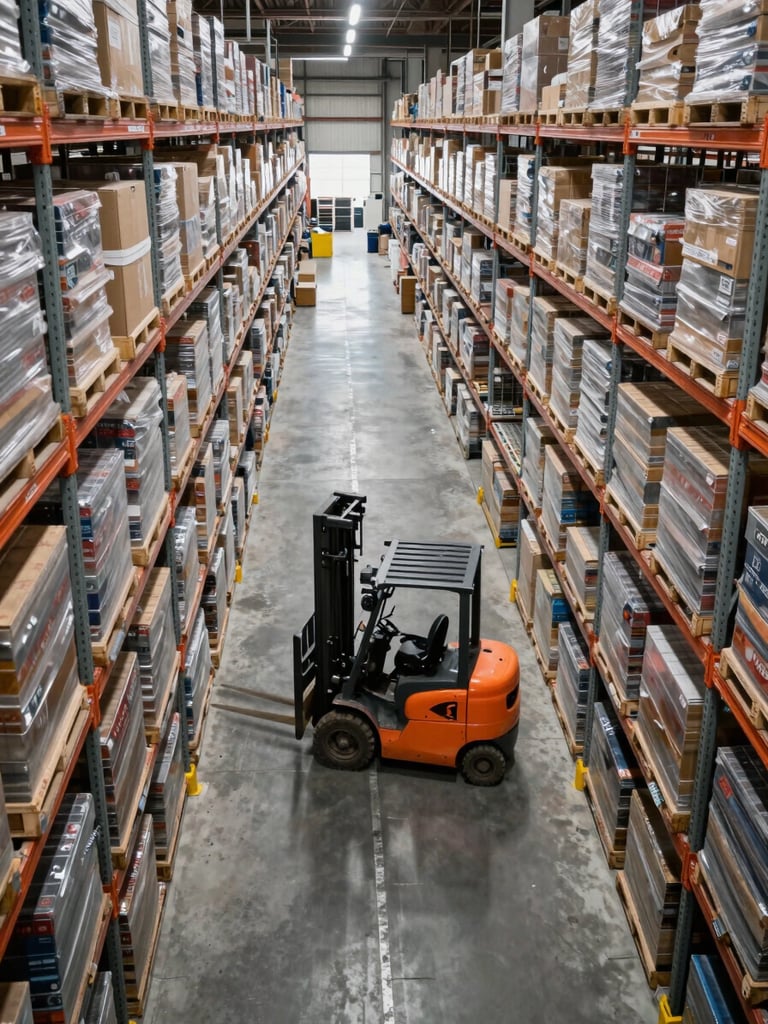
A fast-growing e-commerce operator had a warehouse layout built for half its current SKU count. Slotting redesign and zone sequencing cut pick errors 61% and improved throughput by 29% with no additional headcount.
Metrics: container dwell time, demurrage charges per quarter, documentation error rate.
Metrics: pick error rate, orders per labor hour, returns attributed to mis-picks.
Our warehouse hadn't been re-slotted since we were a third of our current size. They diagnosed the bottleneck in the first week. The throughput numbers from month two are still the benchmark our team uses.
What the operators say after the work is done
We had been absorbing the same freight overages for two years. In eight weeks they found the source, fixed the routing, and the savings showed up on the next invoice. It stayed fixed.
— Director of Supply Chain, E-Commerce Retailer
— VP of Operations, Regional Food Distributor
Your cost leakage has a location. Let's find it.
A focused operations assessment identifies the three highest-impact changes in your current logistics process — specific to your facility, your freight, your numbers.